Living Data · Licensing
Licensing & Charters
The U.S. banking system has undergone a structural transformation driven by decades of charter creation and closure dynamics. This panel traces that evolution from the earliest FDIC records through the present quarter, revealing the long consolidation trend that has reshaped American finance.
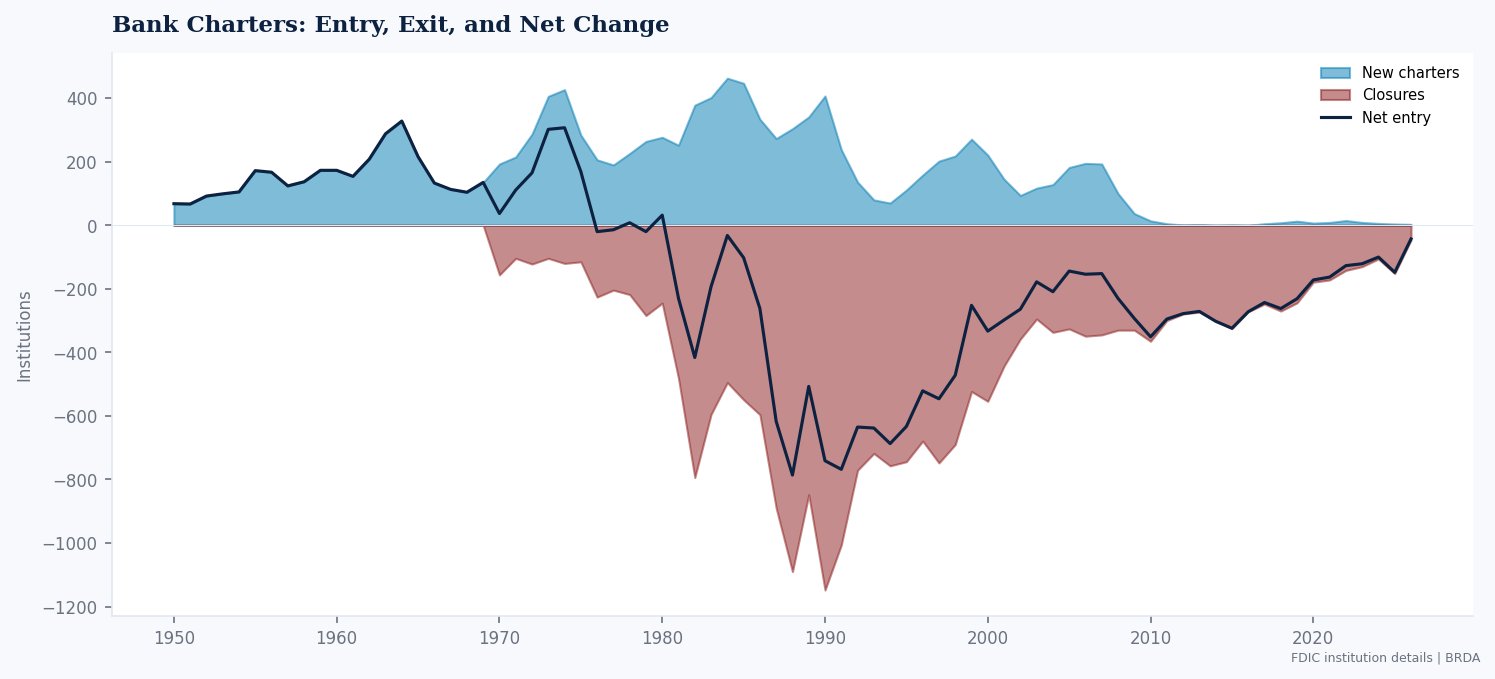
New charters vs closures
Quarterly counts of newly granted bank charters and institution closures (failures, voluntary liquidations, and mergers that extinguish a charter). The gap between the two series captures the pace of industry consolidation.
States with most bank exits (2015+)
Geographic concentration of banking consolidation since 2015. Net entry equals new charters minus closures, aggregated by state. Negative values indicate net contraction of the local banking sector.
White Paper: The De Novo Desert
Why did new bank formation collapse after 2008 — and what does the recovery look like? This panel provides the quarterly charter and closure counts, state-level net entry, and failure-vs-merger decomposition needed to study barriers to entry in banking. Combined with the master research panel, it enables county-level analysis of how consolidation affects credit availability.
Applications: Bank entry barrier estimation, market structure dynamics, credit desert identification, merger impact assessment, community bank sustainability analysis
Explore further
Enforcement Intensity
Cross-agency enforcement actions tracked quarterly. FDIC, CFPB, and FinCEN actions visualized in your browser.
explore →Supervisory Exposure
Composite bank-level index combining enforcement, capital stress, licensing events, and BHC structure.
explore →All Living Data
Browse every panel in the Living Data collection and download the underlying datasets.
explore →