BRDA Living Data · Supervisory Exposure
Bank Supervisory Exposure
This panel aggregates enforcement intensity, capital stress indicators, licensing events, and BHC-level supervision into a single composite index for each FDIC-insured institution. The full panel covers 1.5 million bank×quarter observations; the charts below show aggregated summaries suitable for browser-side rendering via DuckDB-WASM.
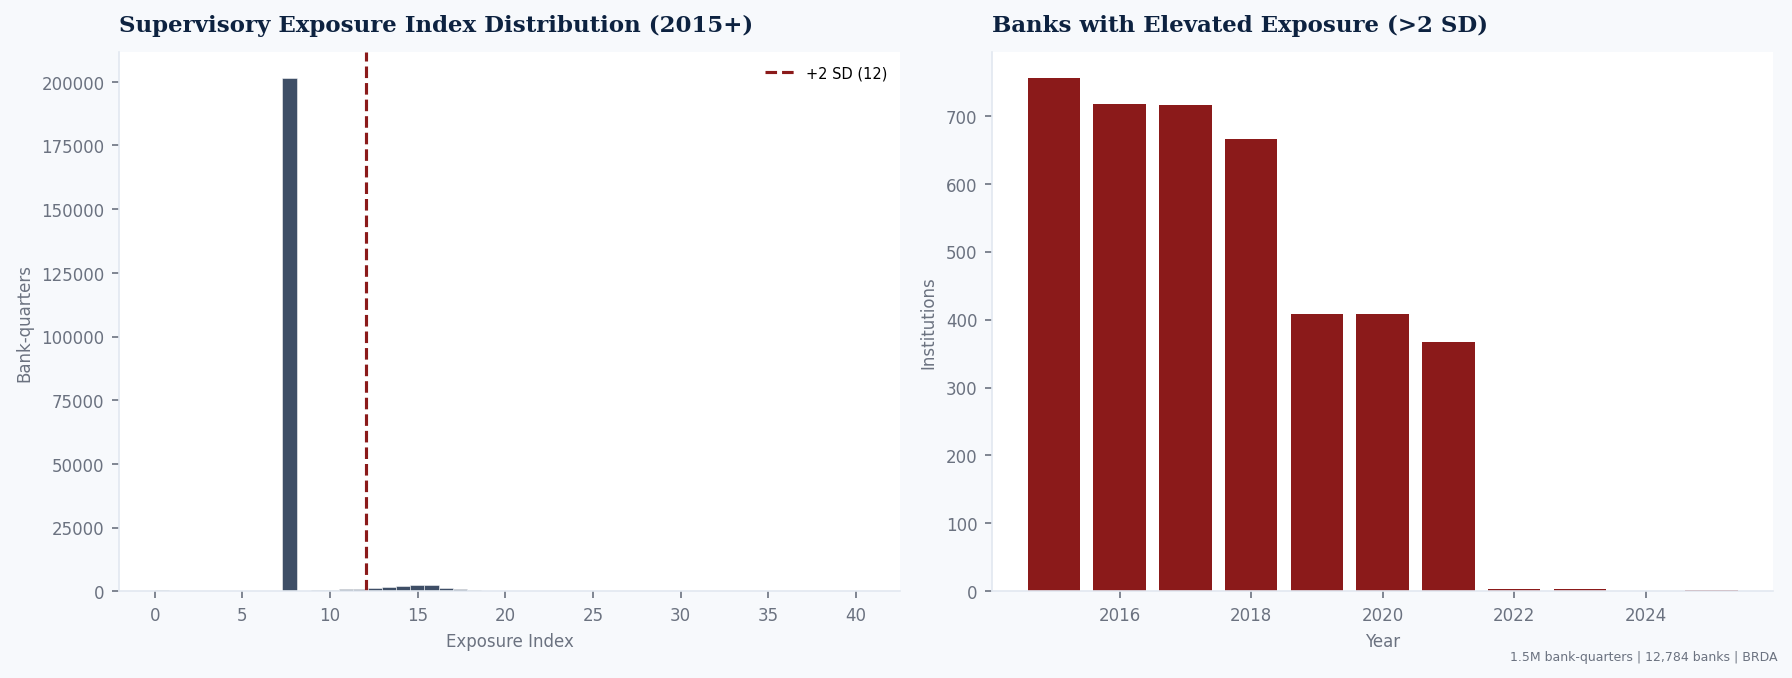
Exposure distribution over time
Mean, median, and 90th-percentile supervisory exposure index by quarter. The gap between mean and p90 reveals the right tail of high-exposure banks.
BHC subsidiaries vs independent banks
Mean exposure for banks that are subsidiaries of bank holding companies compared to independently chartered institutions.
Top 50 highest-exposure banks
The 50 banks with the highest composite supervisory exposure index in the most recent quarter. Color indicates BHC subsidiary status.
Enforcement intensity over time
Total enforcement actions per quarter (bars) overlaid with the count of active banks (line), showing how enforcement tracks industry size.
White Paper: The Supervisory Burden
Do banks under heavy supervisory scrutiny lend less? This panel provides the bank-level composite exposure index needed to estimate the real effects of supervision. Cross-sectional variation in enforcement intensity, capital stress, and regulatory complexity creates natural treatment groups for difference-in-differences designs. Pair with the master research panel for lending outcomes.
Applications: Supervisory burden estimation, regulatory cost-benefit analysis, bank-level event studies, too-big-to-fail vs community bank comparison, DFAST impact measurement