Living Data · Enforcement
Enforcement Intensity
This panel tracks formal enforcement actions across the FDIC, CFPB, and FinCEN by quarter. The charts below load parquet files directly into your browser via DuckDB-WASM and render with Observable Plot — no server required. Use the controls to filter by agency and time period.
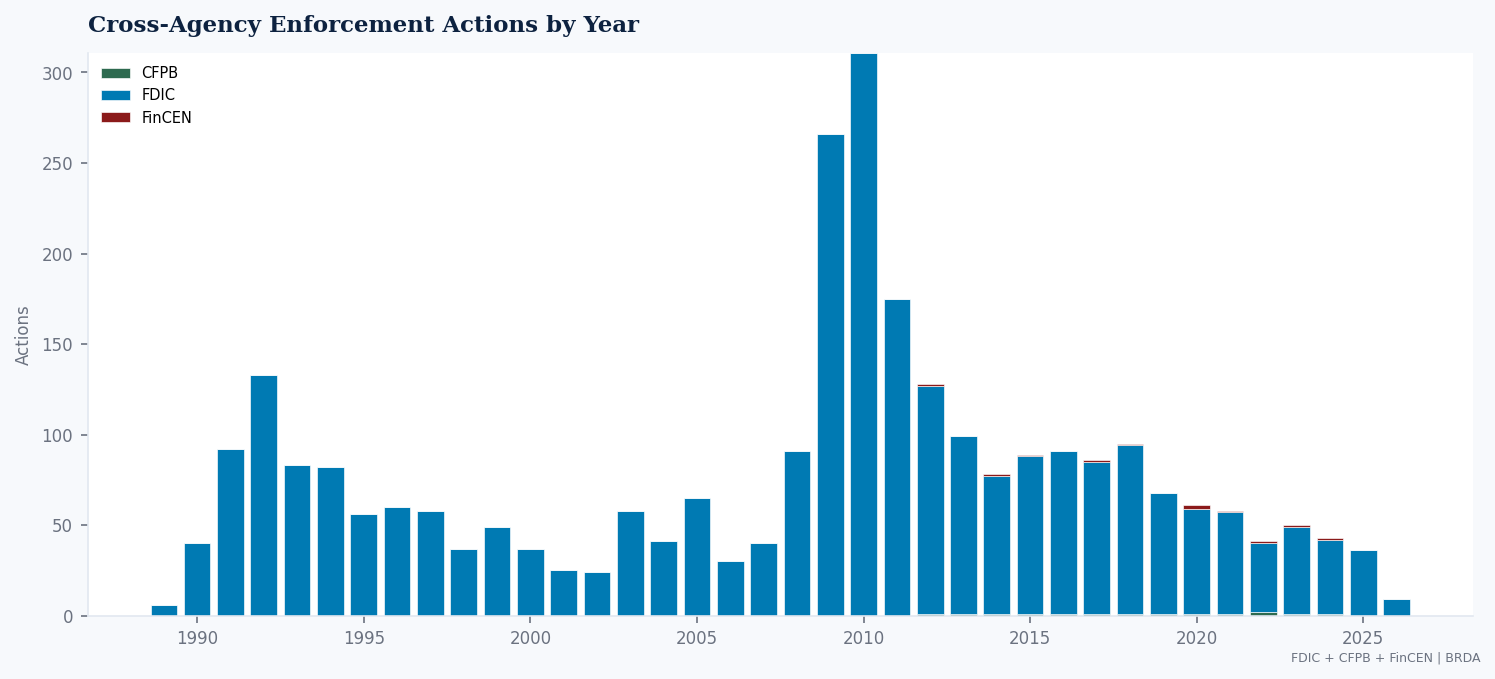
Actions by agency per quarter
Quarterly enforcement action counts by agency. Color indicates the issuing regulator. Hover for detail on any quarter.
Actions by type
Top 10 enforcement action types across all agencies in the selected period. Sorted by total count.
White Paper: Supervisory Escalation Dynamics
Do enforcement surges follow predictable patterns — or are they driven by agency-specific political cycles? This panel provides the quarterly action counts, penalty magnitudes, and cross-agency timing needed to test whether enforcement intensity propagates across agencies after one acts. Pair with the supervisory exposure panel for bank-level event studies.
Applications: Regulatory enforcement forecasting, penalty severity modeling, cross-agency contagion estimation, compliance cost projection
Explore further
Licensing & Charters
New charters vs closures since 1934. Net entry by state. The long consolidation trend in American banking.
explore →Regulatory Attention
Topic mention rates across 20 policy domains, tracked across 15+ corpora by year and quarter.
explore →All Living Data Panels
Return to the Living Data hub for the intelligence briefing and links to all six auto-updating panels.
explore →